Occasionally I hear folks talking about how much Bowen has changed and how many unfamiliar faces they see, so I thought I’d try and quantify that change by comparing the 2006 and the 2016 census, with some references to the 2011 census, and in the process maybe explain some of the perceived changes.��
��
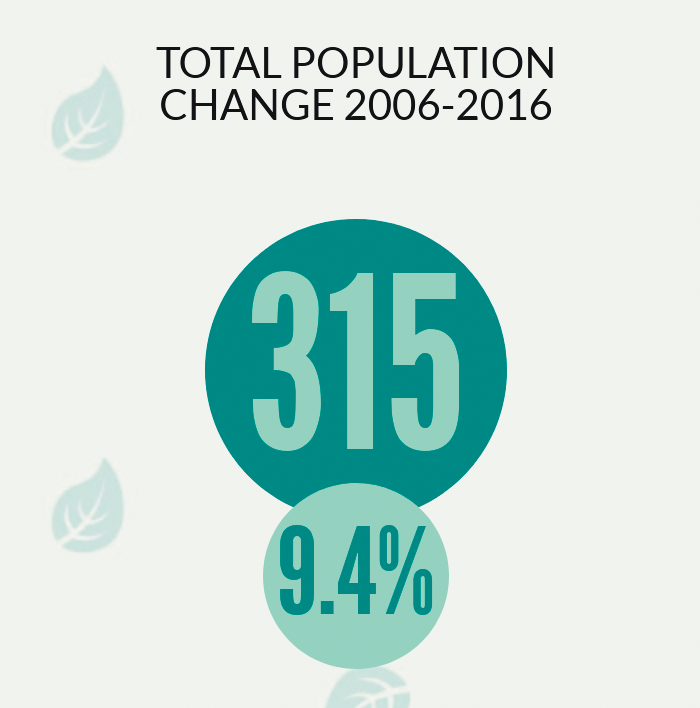
Population Change – New Faces/New Neighbours
The population of Bowen Island increased by 37 from 2006 to 2011 and by 278 from 2011 to 2016—an increase of 315 over the decade.
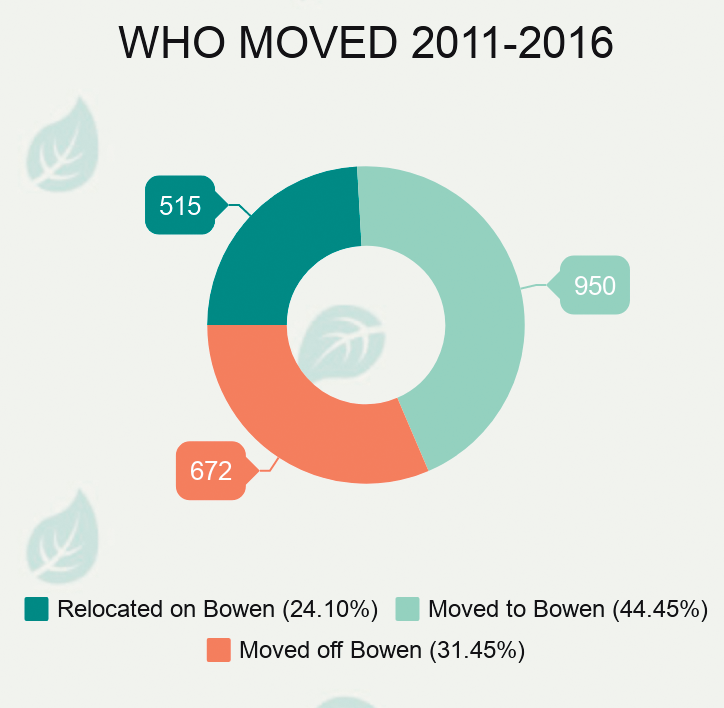
Real estate sales suggest that most of the growth (950 new residents) came in the latter half of the 2016 census period when property values began to regain ground after the 2008 slump. Six hundred and seventy-two people left the island during this period, many were homeowners reluctant or unable to sell during the slump and finally able to list their homes, making way for new residents.��
The new faces we see and the new neighbours we have are mostly result of population ‘churn’ rather than population growth.
��
Age and education - we’re older and more educated
We’re officially closer to 50 than 40. The median age of the population is 48.7—up from 44.8 in 2006—and 4.6 years older than the median age for Metro Vancouver. The number of residents over age 55 increased, while the number and distribution of islanders age 0 to 39 was relatively unchanged.��
Measured over the decade, the numbers suggest that generally Bowen Island is attractive to families with pre-school and elementary school-age children and empty-nesters and retirees aged 55-74. Attrition in the 75-and-older age group is typically seniors moving for more immediate access to health care.
More islanders have more education. The number of people over 15 years-of-age with no certificate, diploma, or degree declined by 23 per cent while the number with an apprenticeship or trades certificate or diploma increased 105 per cent and those with a bachelor’s degree or higher increased 196 per cent since 2006.
If higher education correlates to higher income, it is not unexpected to see the level of education attained rise as household income rises.
��
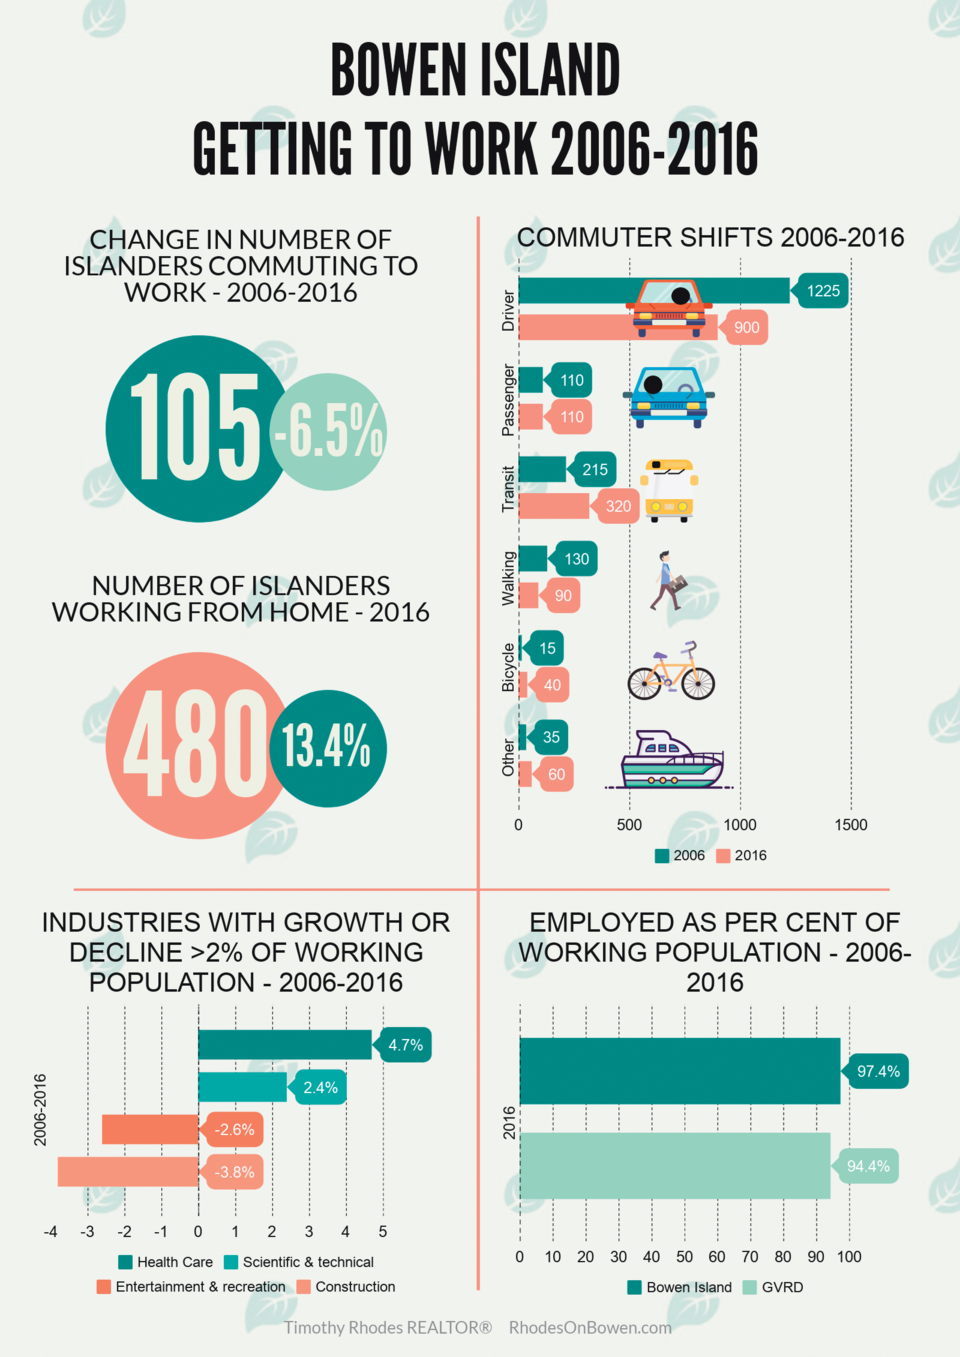
Who’s working where and how are they getting there?
Sixty-seven per cent of Bowen Islanders over the age of 15 identify as part of the labour force. One-in-four Islanders work from home and 1/3 (representing 18.5 per cent of the population) commute off-island to their ‘usual place of work’. Conventional wisdom would set this number closer to 40-50 per cent; however, even adding high school-age children to the mix, less than 1/4 of the total population commutes off-island.
Also bucking conventional wisdom: Improved ferry capacity and fewer overloads (excepting re-fit periods) did not encourage more commuting by private vehicle. Two hundred and fifteen fewer people reported commuting as a driver in a private vehicle and 105 more islanders used public transit.
If you’re finding it increasingly difficult to find a builder, it’s probably because the construction industry took the biggest hit in the last decade. We had 80 fewer construction workers in 2016 than in 2006. While the 950 new residents over the period account for the increases and minor fluctuations in categories of work, the changes in construction can only be attributed to attrition as workers in this category who were forced to find off-island work after the 2008 slump and have not returned.��